Specifying Intent in Lux
Lux provides a flexible language for communicating your analysis intent to the system, so that Lux can provide better and more relevant recommendations to you. In this tutorial, we will see different ways of specifying the intent, including the attributes and values that you are interested or not interested in, enumeration specifiers, as well as any constraints on the visualization encoding.
The primary way to set the current intent associated with a dataframe is by setting the intent property of the dataframe, and providing a list of specification as input. We will first describe how intent can be specified through convenient shorthand descriptions as string inputs, then we will describe advance usage via the lux.Clause object.
Basic descriptions
Specifying attributes of interest
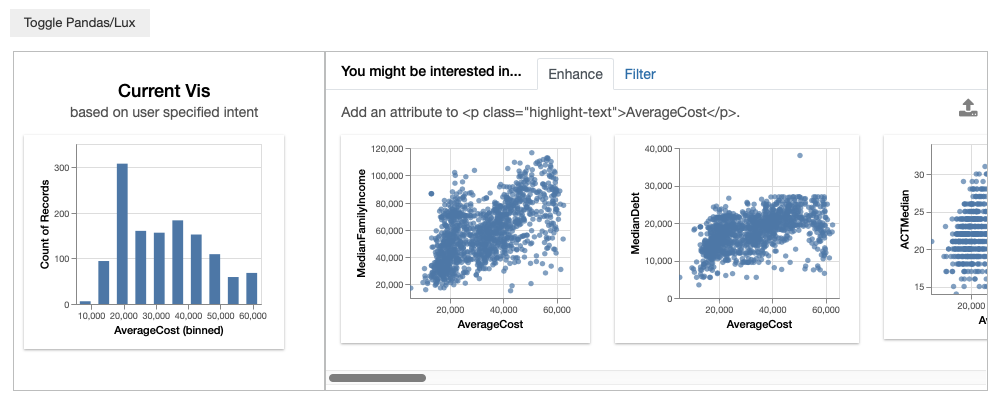
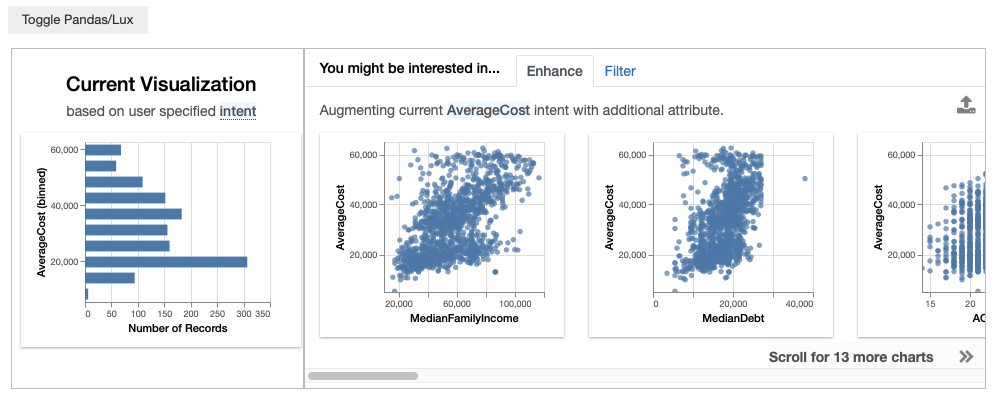
You can indicate that you are interested in an attribute, let’s say AverageCost.
df.intent = ['AverageCost']
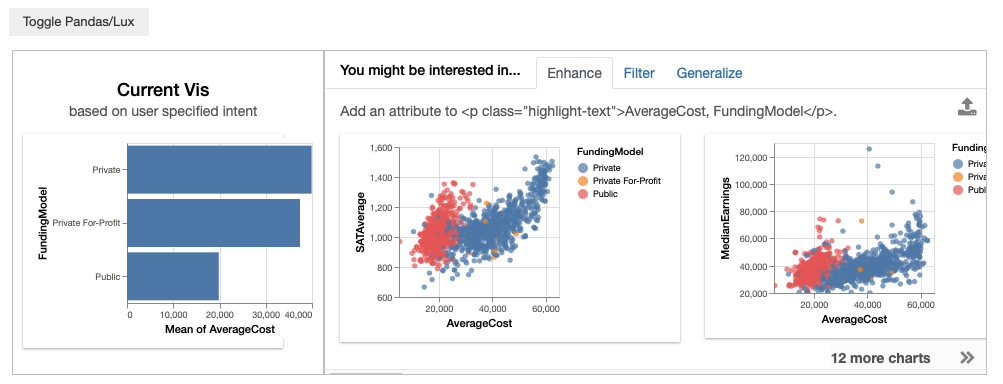
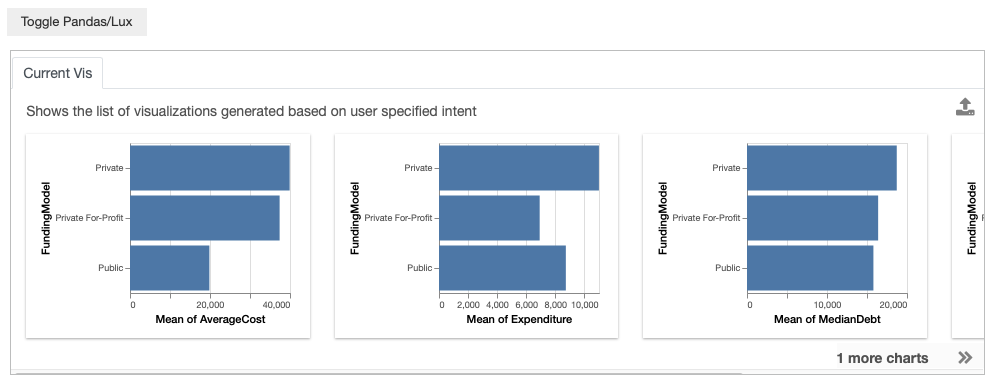
You might be interested in multiple attributes, for instance you might want to look at both AverageCost and FundingModel. When multiple clauses are specified, Lux applies all the clauses in the intent and searches for visualizations that are relevant to AverageCost and FundingModel.
df.intent = ['AverageCost','FundingModel']
df
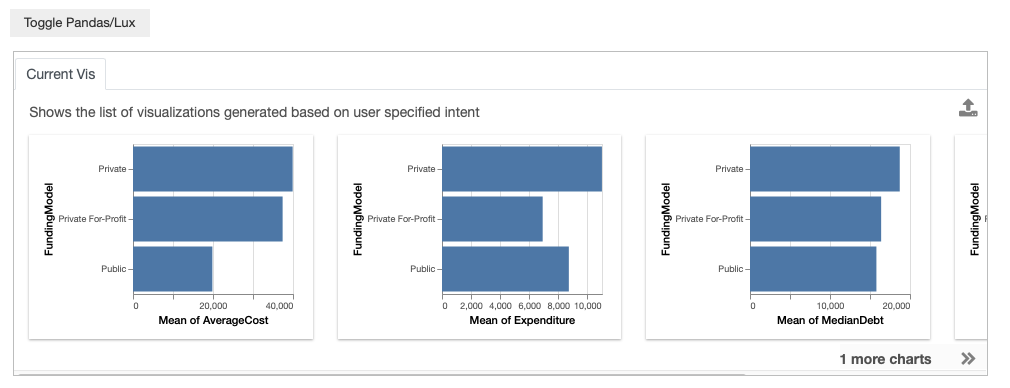
Let’s say that in addition to AverageCost, you are interested in the looking at a list of attributes that are related to different financial measures, such as Expenditure or MedianDebt, and how they breakdown with respect to FundingModel.
You can specify a list of desired attributes separated by the | symbol, which indicates an OR relationship between the list of attributes. If multiple clauses are specified, Lux automatically create combinations of the specified attributes.
possible_attributes = "AverageCost|Expenditure|MedianDebt|MedianEarnings"
df.intent = [possible_attributes,"FundingModel"]
df
Alternatively, you could also provide the specification as a list:
possible_attributes = ['AverageCost','Expenditure','MedianDebt','MedianEarnings']
df.intent = [possible_attributes,"FundingModel"]
df
Specifying values of interest
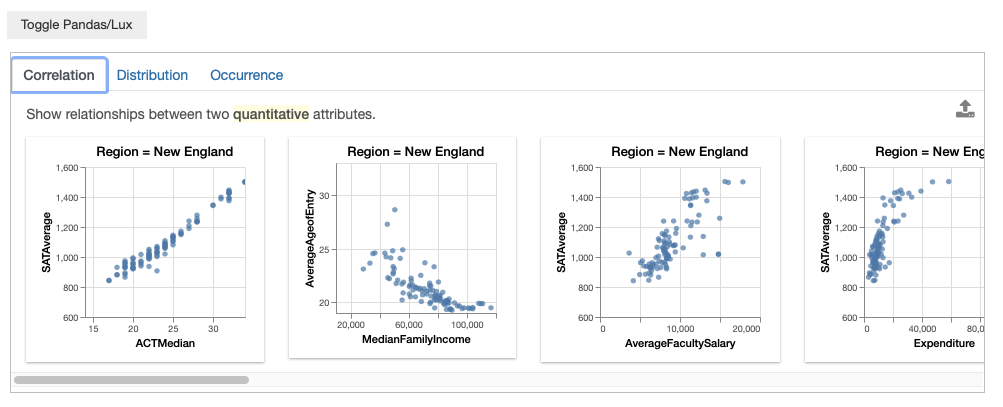
In Lux, you can also specify particular values corresponding to subsets of the data that you might be interested in. For example, you may be interested in only colleges located in New England.
df.intent = ["Region=New England"]
df
You can also specify multiple values of interest using the same | notation that we saw earlier. For example, you might be comparing colleges in New England, Southeast, and Far West.
df.intent = ["MedianDebt","Region=New England|Southeast|Far West"]
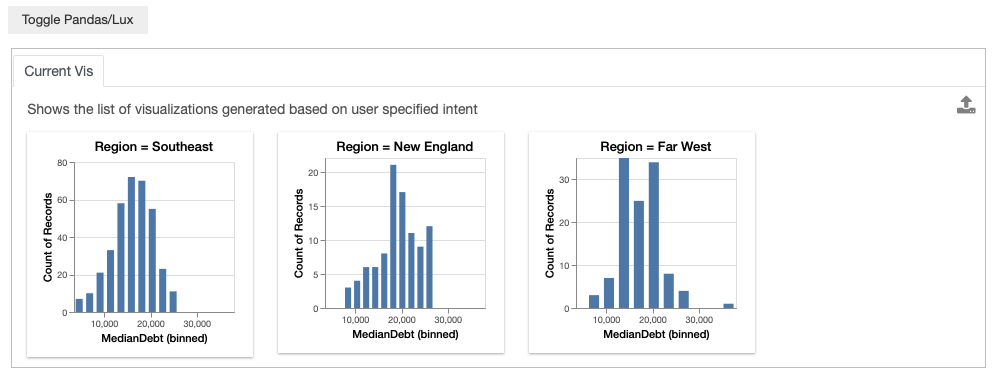
Note that since there are three different visualizations that is generated based on the intent, we only display these possible visualization, rather than the recommendations
Note
You might be wondering what is the difference between specifying values of interest through the intent in Lux versus applying a filter directly on the dataframe through Pandas. By specifying the intent directly via Pandas, Lux is not aware of the specified inputs to Pandas, so these values of interest will not be reflected in the recommendations.
df[df["Region"]=="New England"]
You can specify to Lux that you are interested in learning more about colleges in New England.
In the resulting Filter action, we see that Lux suggests visualizations in other Region as recommendations.
df.intent = ["Region=New England"]
df
So while both approaches applies the filter on the specified visualization, the subtle difference between applying a filter and indicating a filter intent leads to different sets of resulting recommendations. In general, we encourage using Pandas for filtering if you are certain about applying the filter (e.g., a cleaning operation deleting a specific data subset), and specify the intent through Lux if you might want to experiment and change aspects related to the filter in your analysis.
Advanced intent specification through lux.Clause
The basic string-based description provides a convenient way of specifying the intent. However, not all specification can be expressed through the string-based descriptions, more complex specification can be expressed through the lux.Clause object. The two modes of specification is essentially equivalent, with the lux.processor.Parser parsing the description field in the lux.Clause object.
Specifying attributes or values of interest
To see an example of how lux.Clause is used, we rewrite our earlier example of expressing interest in AverageCost as:
df.intent = [lux.Clause(attribute='AverageCost')]
Similarly, we can use lux.Clause to specify values of interest:
df.intent = ['MedianDebt',
            lux.Clause(attribute='Region',filter_op='=', value=['New England','Southeast','Far West'])]
Both the attribute and value fields can take in either a single string or a list of attributes to specify items of interest. This example also demonstrates how we can intermix the lux.Clause specification alongside the basic string-based specification for convenience.
Adding constraints to override auto-inferred details
So far, we have seen examples of how Lux takes in a loosely specified intent and automatically fills in many of the details that is required to generate the intended visualizations. There are situations where the user may want to override these auto-inferred values. For example, you might be interested in fixing an attribute to show up on a particular axis, ensuring that an aggregated attribute is summed up instead of averaged by default, or picking a specific bin size for a histogram. Additional properties specified on lux.Clause acts as constraints to the specified intent.
Fixing attributes to specific axis channels
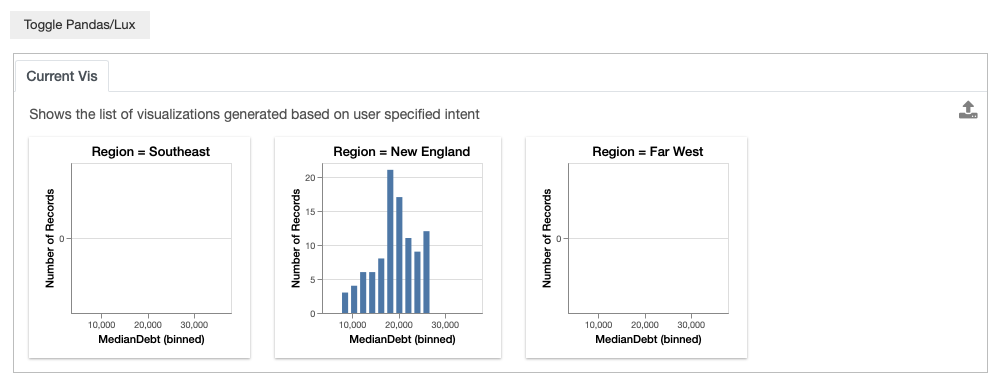
As we saw earlier, when we set AverageCost as the intent, Lux generates a histogram with AverageCost on the x-axis. While this is unconventional, let’s say that instead we want to set AverageCost to the y axis. We would specify this as additional properties to constrain the intent clause.
df.intent = [lux.Clause(attribute='AverageCost', channel='y')]
df
Changing aggregation function applied
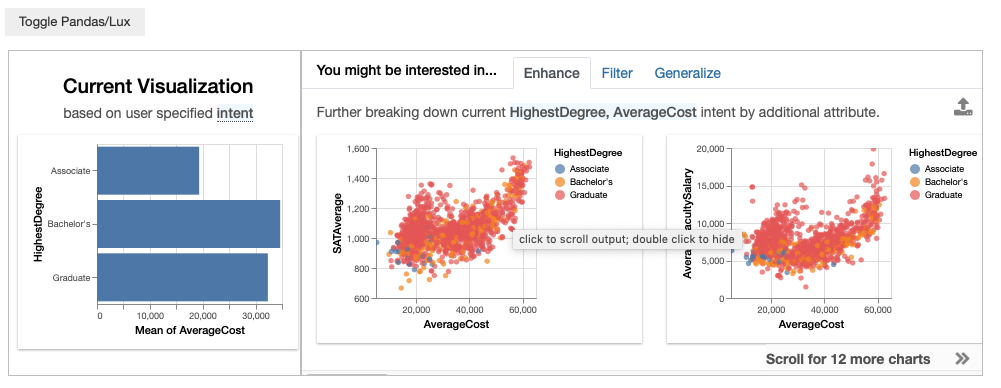
We can also set constraints on the type of aggregation that is used. For example, by default, we use mean as the default aggregation function for quantitative attributes.
df.intent = ["HighestDegree","AverageCost"]
df
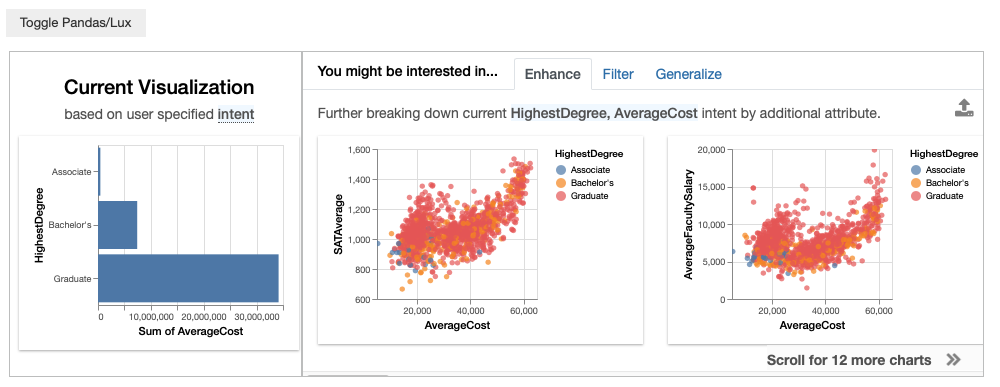
We can override the aggregation function to be sum instead.
df.intent = ["HighestDegree",lux.Clause("AverageCost",aggregation="sum")]
df
The possible aggregation values are the same as the ones supported in Pandas’s agg function, which can either be a string shorthand (e.g., “sum”, “count”, “min”, “max”, “median”) or as a numpy aggregation function.
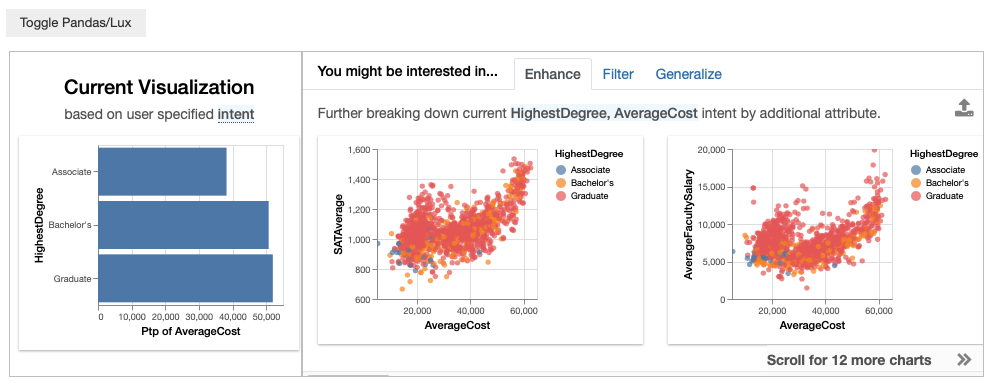
For example, we can change the aggregation function to be the point-to-point value (np.ptp) by inputting the numpy function.
df.intent = ["HighestDegree",lux.Clause("AverageCost",aggregation=np.ptp)]
df
Specifying wildcards
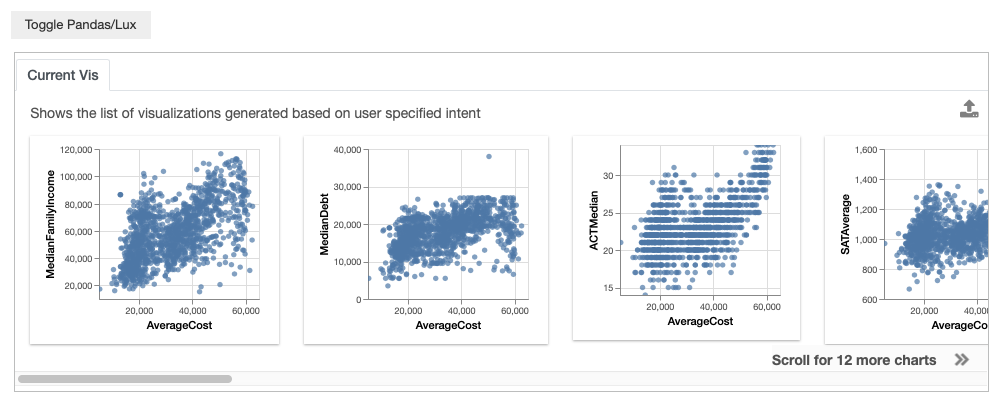
Let’s say that you are interested in any attribute with respect to AverageCost. Lux support wildcards (based on CompassQL ), which specifies the enumeration of any possible attribute or values that satisfies the provided constraints.
df.intent = ['AverageCost',lux.Clause('?')]
df
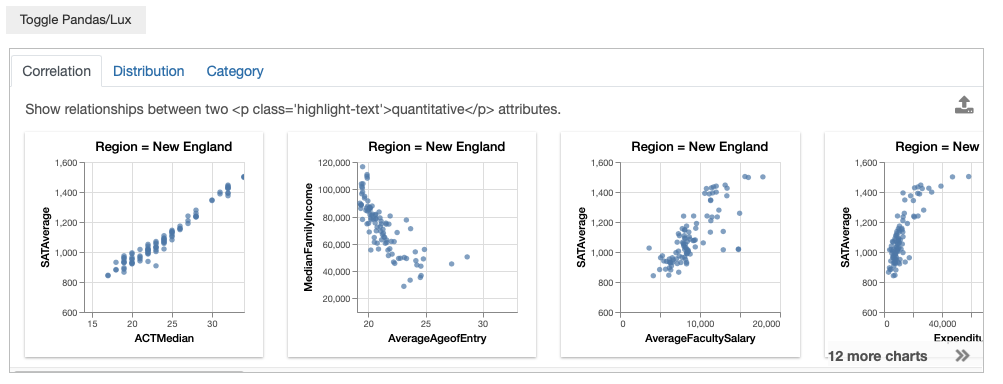
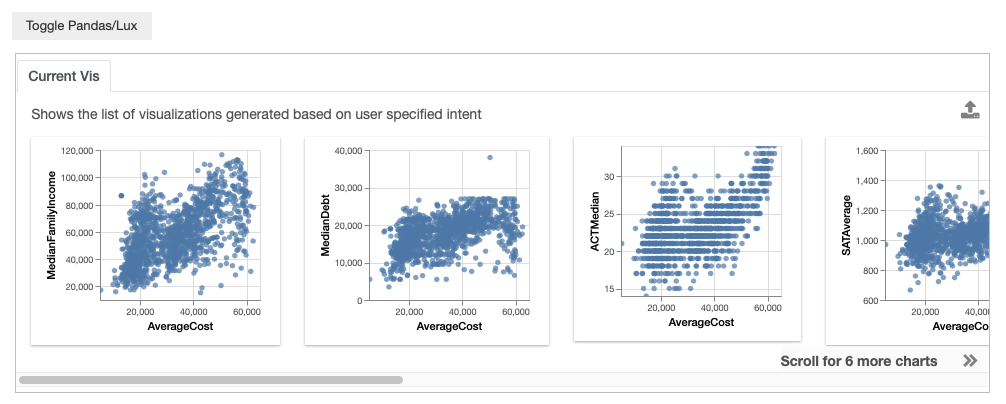
The space of enumeration can be narrowed based on constraints. For example, you might only be interested in looking at scatterplots of AverageCost with respect to quantitative attributes. This narrows the 15 visualizations that we had earlier to only 9 visualizations now, involving only quantitative attributes.
df.intent = ['AverageCost',lux.Clause('?',data_type='quantitative')]
df
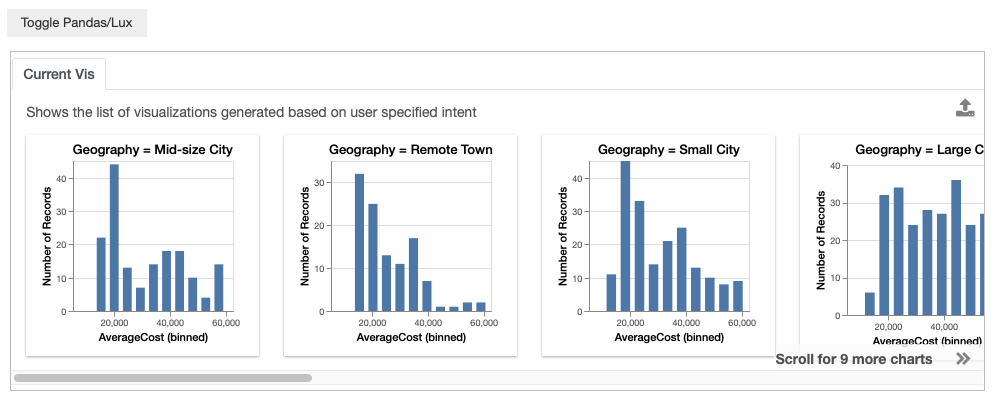
The enumeration specifier can also be placed on the value field. For example, you might be interested in looking at how the distribution of AverageCost varies for all possible values of Geography.
df.intent = ['AverageCost','Geography=?']
or
df.intent = ['AverageCost',lux.Clause(attribute='Geography',filter_op='=',value='?')]
df