Working with Temporal Datetime Columns
This is a tutorial on how to prepare temporal data for use with Lux. To display temporal fields in Lux, the column must be converted into Pandas’s datetime objects.
Converting Strings to Datetime objects
To convert column referencing dates/times into datetime objects, we use pd.to_datetime , as follows:
pd.to_datetime(['2020-01-01', '2020-01-15', '2020-02-01'],format="%Y-%m-%d")
As a toy example, a dataframe might contain a date attribute as strings of dates:
df = pd.DataFrame({'date': ['2020-02-01', '2020-03-01', '2020-04-01', '2020-05-01','2020-06-01',],
           'value': [10.5,15.2,20.3,25.2, 14.2]})
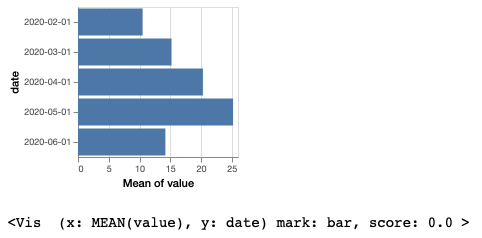
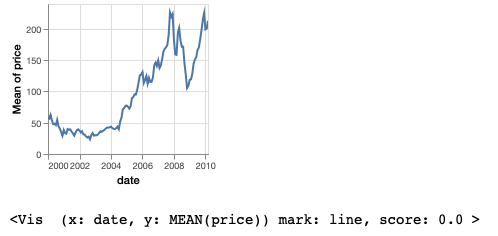
By default, the date attribute is detected as an object type as Pandas’s data type dtype :
df.dtypes
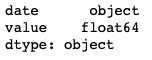
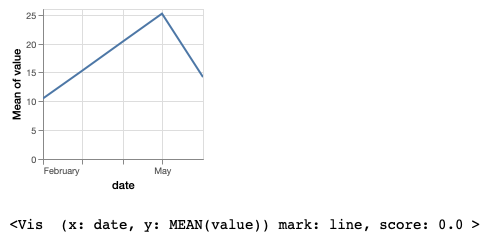
Since date is detected as an object type in Pandas, the date field is recognized as a nominal field in Lux, instead of a temporal field:
df.data_type

The typing has implications on the generated visualizations, since nominal chart types are displayed as bar charts, whereas temporal fields are plotted as time series line charts.
vis = Vis(["date","value"],df)
vis
To fix this, we can convert the date column into a datetime object by doing:
df['date'] = pd.to_datetime(df['date'],format="%Y-%m-%d")
df['date']
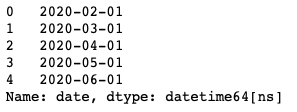
After changing the Pandas data type to datetime, we see that date field is recognized as temporal fields in Lux.
df.data_type

vis.refresh_source(df)
vis
Visualizing Trends across Different Timescales
Lux automatically detects the temporal attribute and plots the visualizations across different timescales to showcase any cyclical patterns. Here, we see that the Temporal tab displays the yearly, monthly, and weekly trends for the number of stock records.
from vega_datasets import data
df = data.stocks()

df.recommendation["Temporal"]

Advanced Date Manipulation
You might notice earlier that all the dates in our example dataset are the first of the month. In this case, there may be situations where we only want to list the year and month, instead of the full date. Here, we look at how to handle these cases.
Below we look at an example stocks dataset that also has date field with each row representing data for the first of each month.
df = pd.read_csv("https://github.com/lux-org/lux-datasets/blob/master/data/stocks.csv?raw=true")

df.dtypes
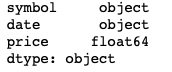
vis = Vis(["date","price"],df)
vis
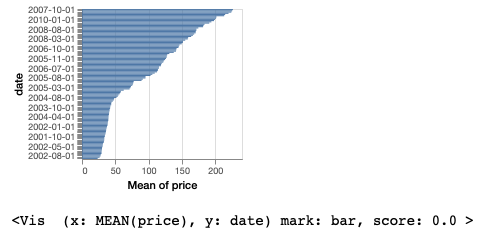
If we only want Lux to output the month and the year, we can convert the column to a PeriodIndex using to_period . The freq argument specifies the granularity of the output. In this case, we are using ‘M’ for monthly. You can find more about how to specify time periods here .
df["date"] = pd.DatetimeIndex(df["date"]).to_period(freq='M')
vis.refresh_source(df)
vis
Specifying Intents With Datetime Fields
The string representation seen in the Dataframe can be used to filter out specific dates.
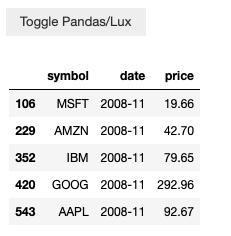
For example, in the above stocks dataset, we converted the date column to a PeriodIndex. Now the string representation only shows the granularity we want to see. We can use that string representation to filter the dataframe in Pandas:
df[df['date'] == '2008-11']
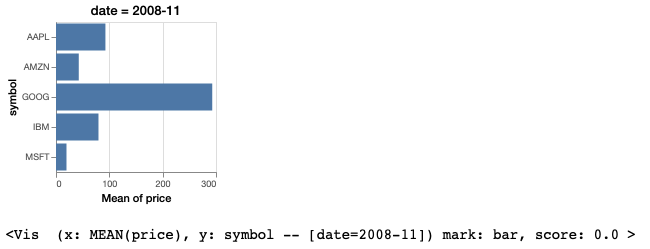
We can also use the same string representation for specifying an intent in Lux.
vis = Vis(["date=2008-11","price","symbol"],df)
vis