Understanding Data Types in Lux
In Lux, data types convey the high-level, semantic roles for each attribute, such as whether it is temporal, nominal, or quantitative. The detected data type information are then used to infer the appropriate types of visualization to display for each attribute. Note that data types in Lux are different from the dtype in Pandas, which involve atomic types such as string, integer, and float. Lux automatically infers the data type information for each column in the dataframe. The following code snippet shows what data types were inferred:
df = pd.read_csv("https://github.com/lux-org/lux-datasets/blob/master/data/college.csv?raw=true")
df.data_type

Supported Data Types
The following data types are supported in Lux:
Quantitative
Quantitative data is used to describe numerical measures.
This data type is typically assigned when Lux a numerical column consisting of floats or integers has large numbers of distinct values.
In the example above, the column AcceptanceRate is detected as an quantitative attribute.
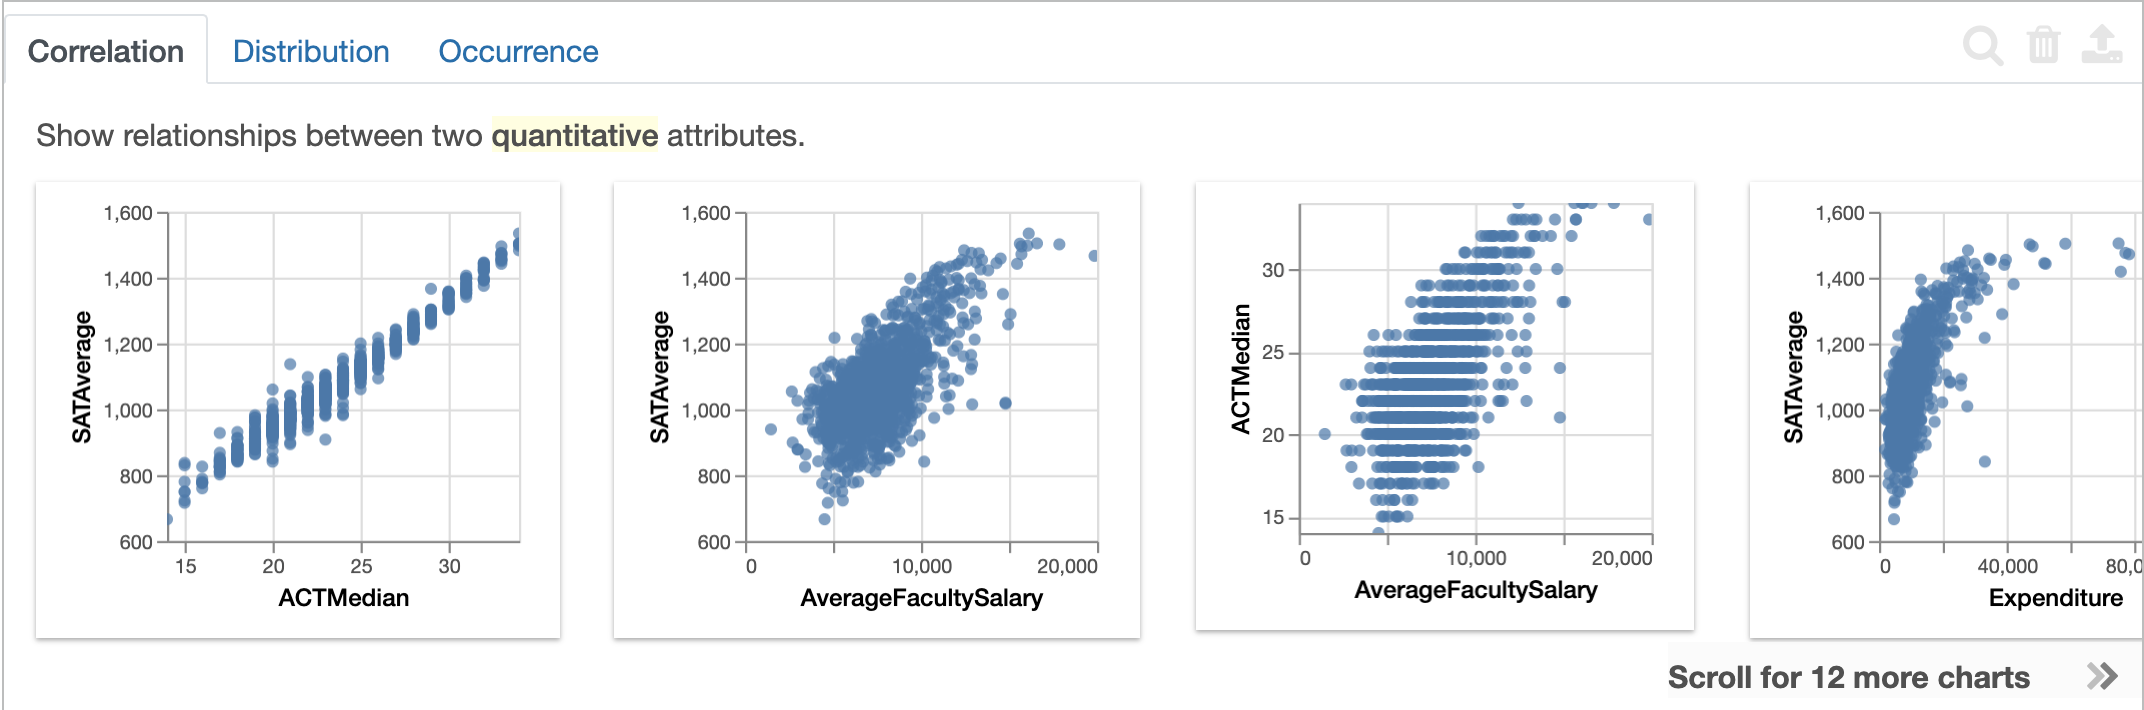
By default, Lux displays the Correlation action, displaying the relationship between two quantitative columns as scatterplots or heatmaps.
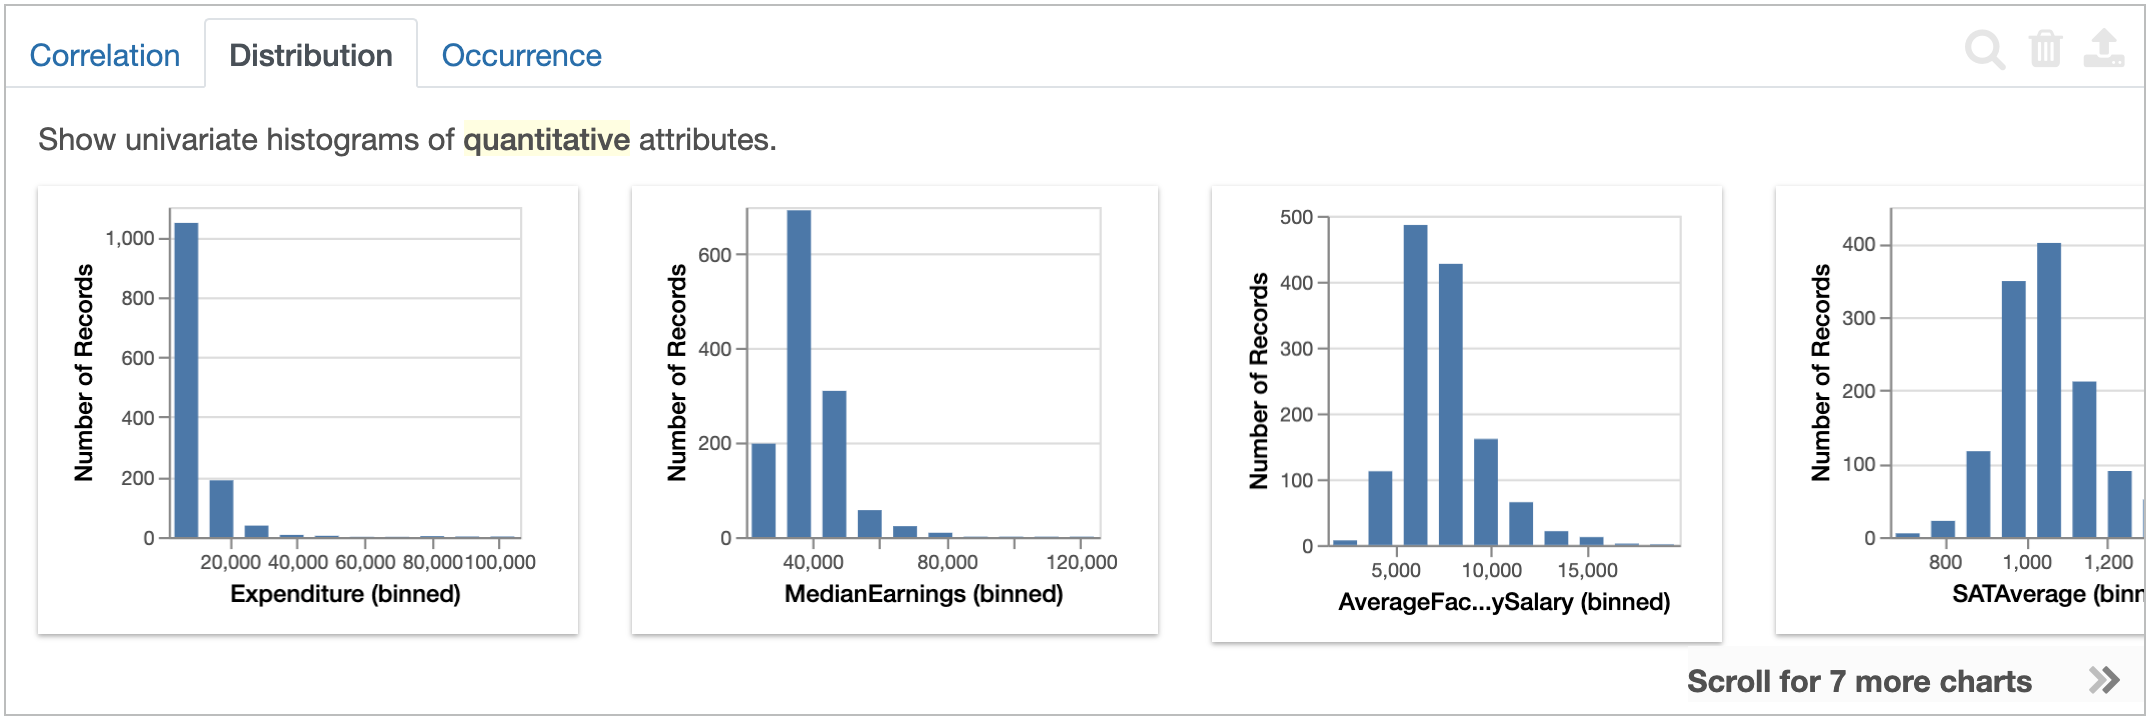
Lux also shows the Distribution action, displaying the distribution of each quantitative attributes.
Nominal
Nominal data types describes unordered, categorical attributes.
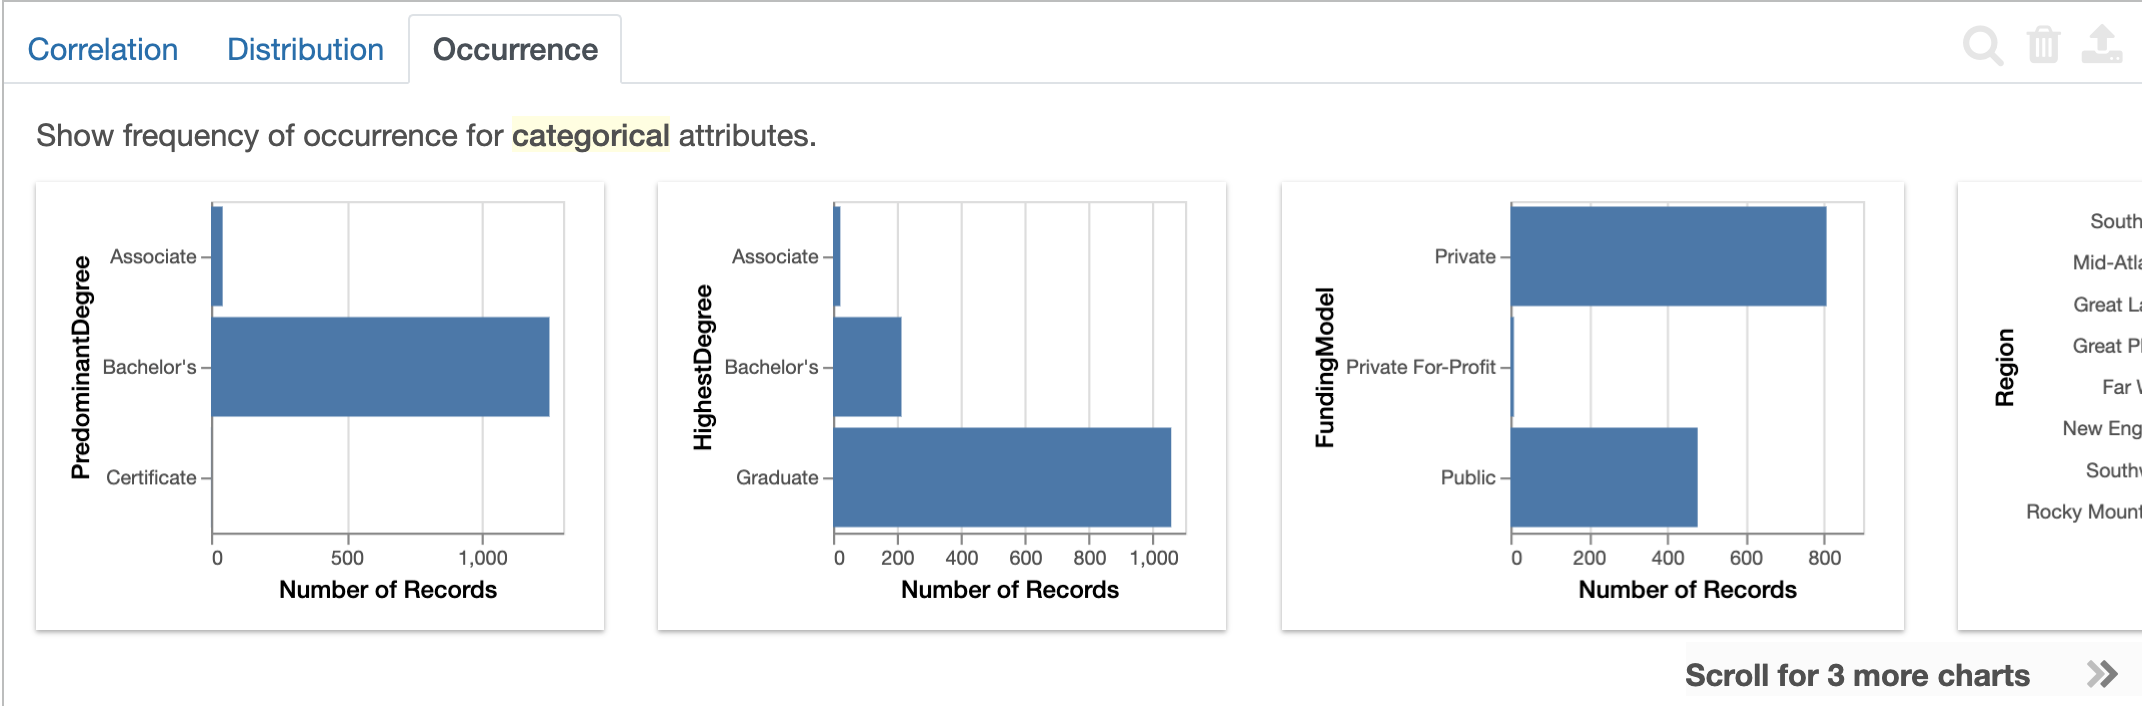
For example, the attribute PredominantDegree is nominal because it contains only three distinct values: Associate, Bachelor's, and Certificate.
Below: Lux displays the occurence counts of nominal variables under the Occurrence action as bar charts.
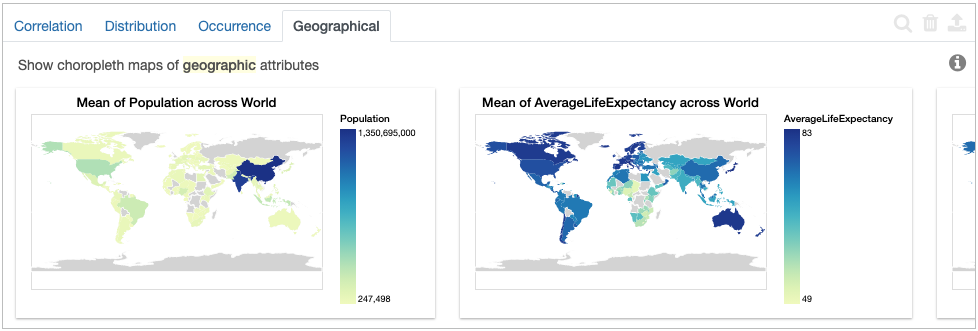
Geographic
Geographic data types describe location-based attributes, such as US states and world countries.
Lux infers that an attribute is geographical if it’s column name is state or country and if the data content contain state or country information. For example, the Country column is detected as a geographic data type in this example:
df = pd.read_csv("https://raw.githubusercontent.com/lux-org/lux-datasets/master/data/hpi.csv")
df
Here, the Geographical tab shows different choropleth maps of how different measures vary by country.
Note
For more information on geographic attributes in Lux, see this tutorial.
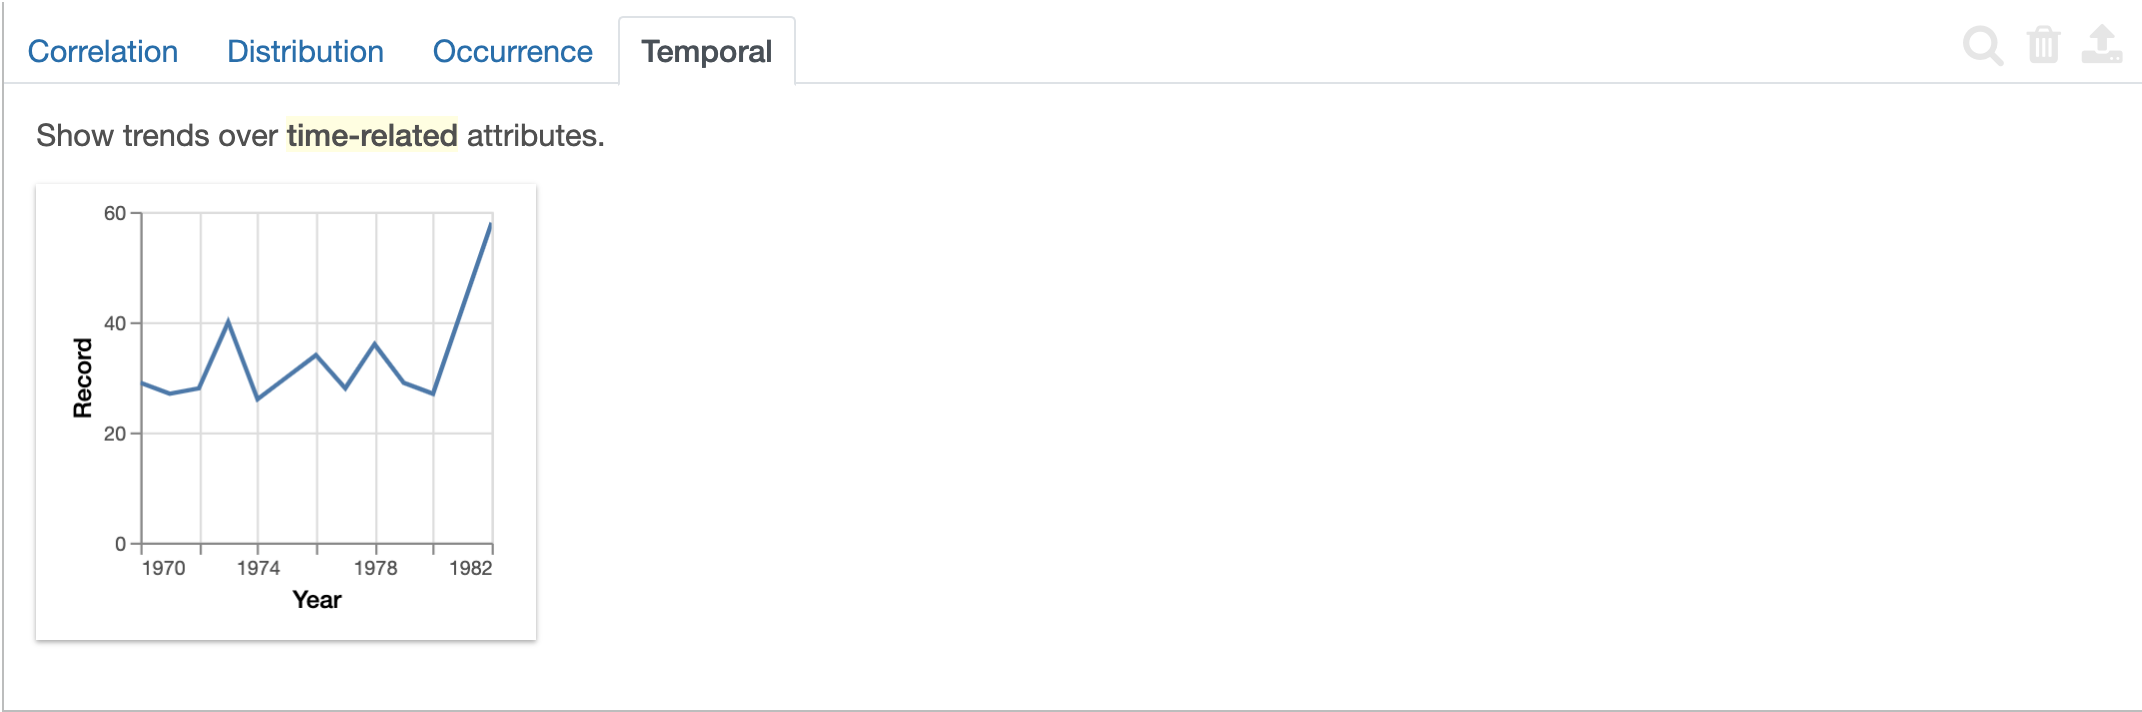
Temporal
Temporal data types describe time-related attributes, such as dates and timestamps.
Lux infers that an attribute is temporal based on the data format, content, and name of the column.
For example, the Year attribute is detected as a temporal data type in this example:
df = pd.read_csv("https://github.com/lux-org/lux-datasets/blob/master/data/car.csv?raw=true")
df["Year"] = pd.to_datetime(df["Year"], format="%Y")
df
Here, the Temporal tab reflects a line graph of the records and time.
Note
For more information on dates in Lux, see this tutorial.
ID
ID data type describes identifier columns, such as zip code, product or user ID.
Typically, columns that are detected as ID data type do not contain a lot of useful information and should not be plotted.
For example, in the code snipped below, we see that the column enrolee_id has numerical data, it is categorized as an ID data type, so no visualizations correspond to it.
df = pd.read_csv("https://github.com/lux-org/lux-datasets/blob/master/data/aug_test.csv?raw=true")
df

Changing the Inferred Data Type
Lux attempts to infer the data type information for every column in the dataframe. However, sometimes there is ambiguity in how the data should be modelled. For example, perhaps an attribute is detected as an ID field, but it is better visualized as a quantitative column. Alternatively, there may be a column that looks quantitative, but would be better modelled as a nominal. For example:
df = pd.read_csv("https://raw.githubusercontent.com/lux-org/lux-datasets/master/data/communities.csv?raw=true")
df.data_type

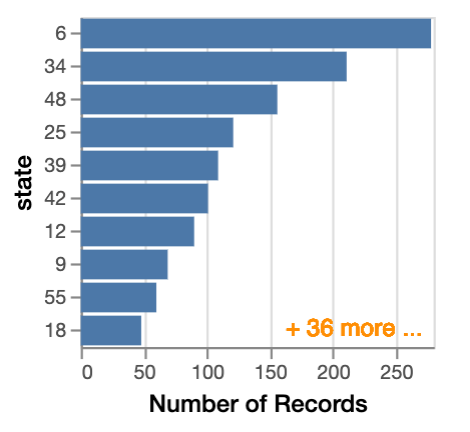
Lux incorrectly assumes that state is a quantitative column because the column seems to be made of numbers. If we plot a visualization based on state, a histogram is displayed:

However, in reality, state does not represent numbers with any meaningful relationship since the numbers discretely map to individual states.
In this case, the state column is better suited as a nominal column.
To change the inferred data type, use the set_data_type method:
df.set_data_type({"state":"nominal"})
The user specified data type information overrides the lux-detected data type.
From now on, Lux will interpret the state column as nominal.
We can validate this by inspecting df.data_type:

Now, when we plot the same visualization again, the nominal state column is displayed as a bar chart visualization. This bar chart visualization shows that state 6, 34, and 48 has the largest number of records, an insight that was hidden away in the binned histogram when the data type was misdetected.