Configuration Settings
In Lux, users can customize various global settings to configure the behavior of Lux through lux.config.Config. These configurations are applied across all dataframes in the session. This page documents some of the configurations that you can apply in Lux.
- Change the default display
- Change the plotting scale
- Change plotting backend for rendering visualizations in Lux
- Change the sampling parameters
- Disable the use of heatmaps for large datasets
- Changing the plotting style
- Modify Sorting and Ranking in Recommendations
- Changing heatmap bin resolution
- Change the maximum number of bars displayed
Note
Lux caches past generated recommendations, so if you have already printed the dataframe in the past, the recommendations would not be regenerated with the new config properties. In order for the config properties to apply, you would need to explicitly expire the recommendations as such:
df = pd.read_csv("..")
df # recommendations already generated here

df.expire_recs()
lux.config.SOME_SETTING = "..."
df # recommendation will be generated again here
Alternatively, you can place the config settings before you first print out the dataframe for the first time:
df = pd.read_csv("..")
lux.config.SOME_SETTING = "..."
df # recommendations generated for the first time with config
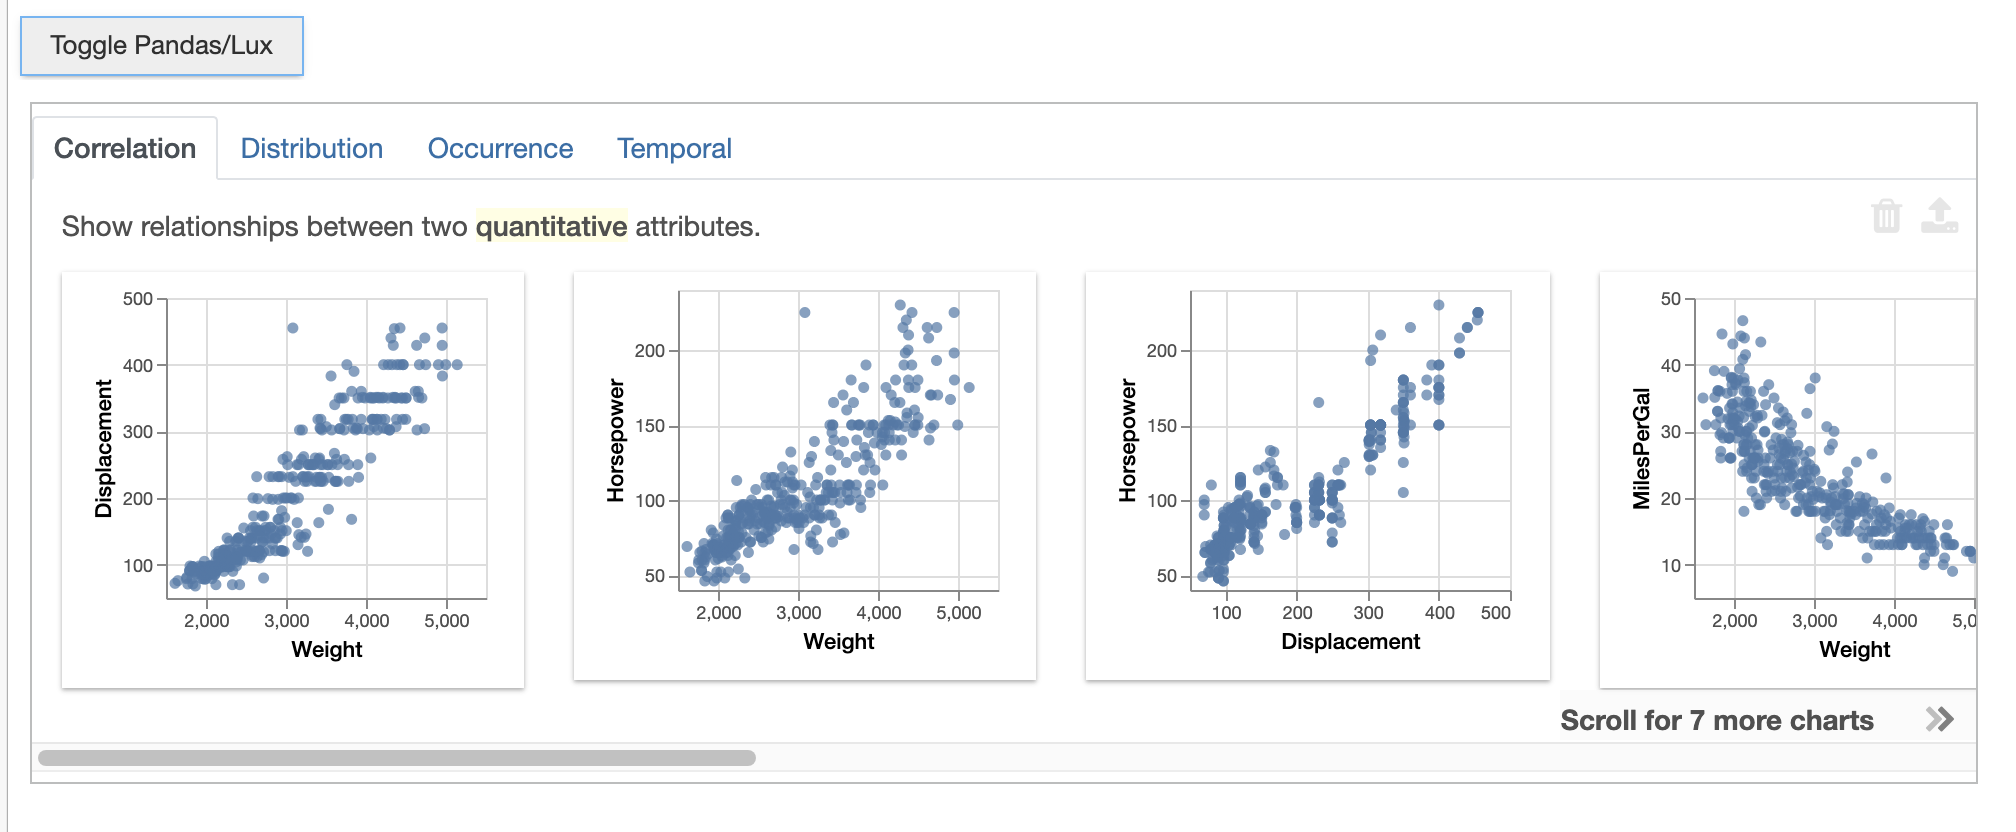
Change the default display
We can set the default_display to change whether the Pandas table or Lux widget is displayed by default. In the following block, we set the default display to ‘lux’, therefore the Lux widget will display first.
lux.config.default_display = "lux"
df
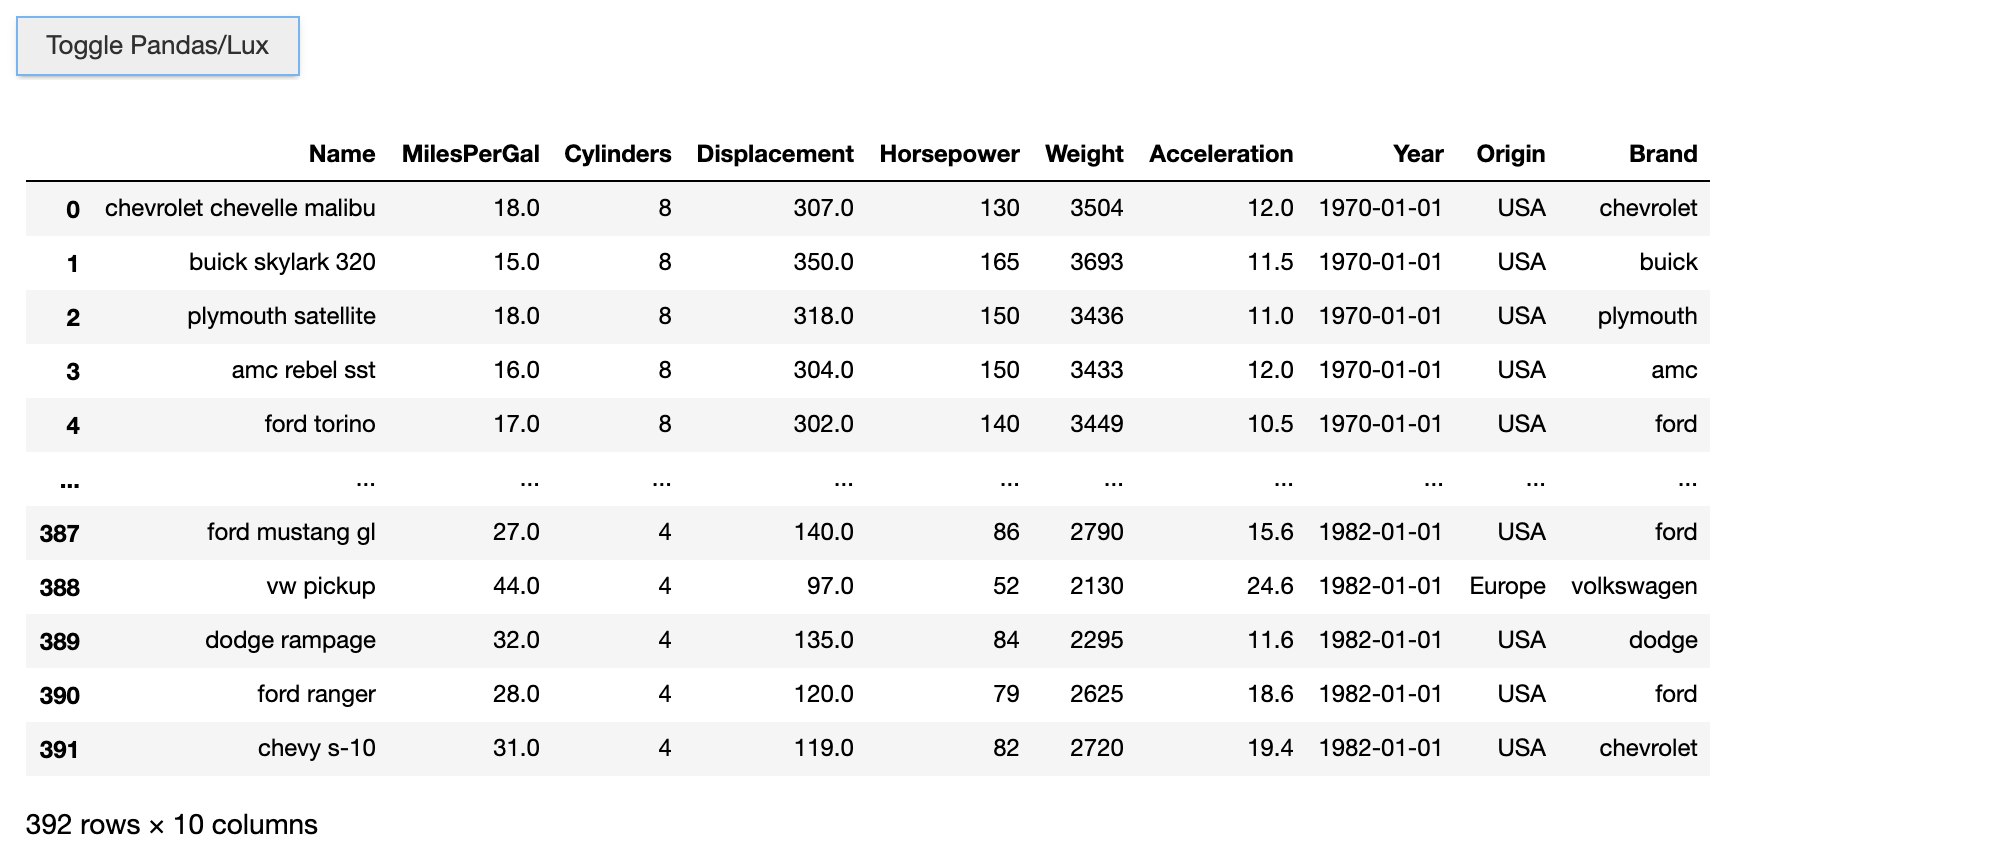
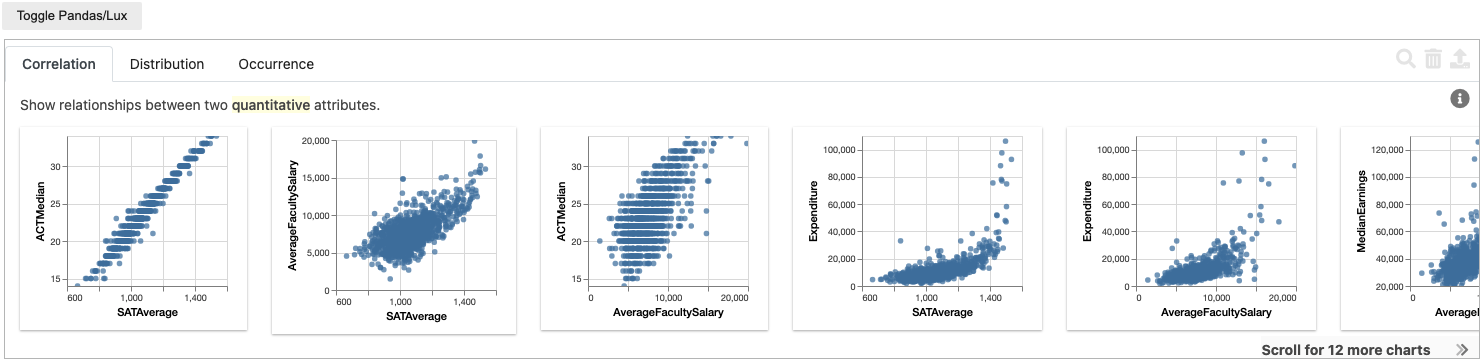
We can set the default_display back to ‘pandas,’ which would allow for the dataframe object to display first. You can still toggle to Lux/Pandas respectively using the ‘Toggle’ button.
lux.config.default_display = "pandas" # Set Pandas as default display
df
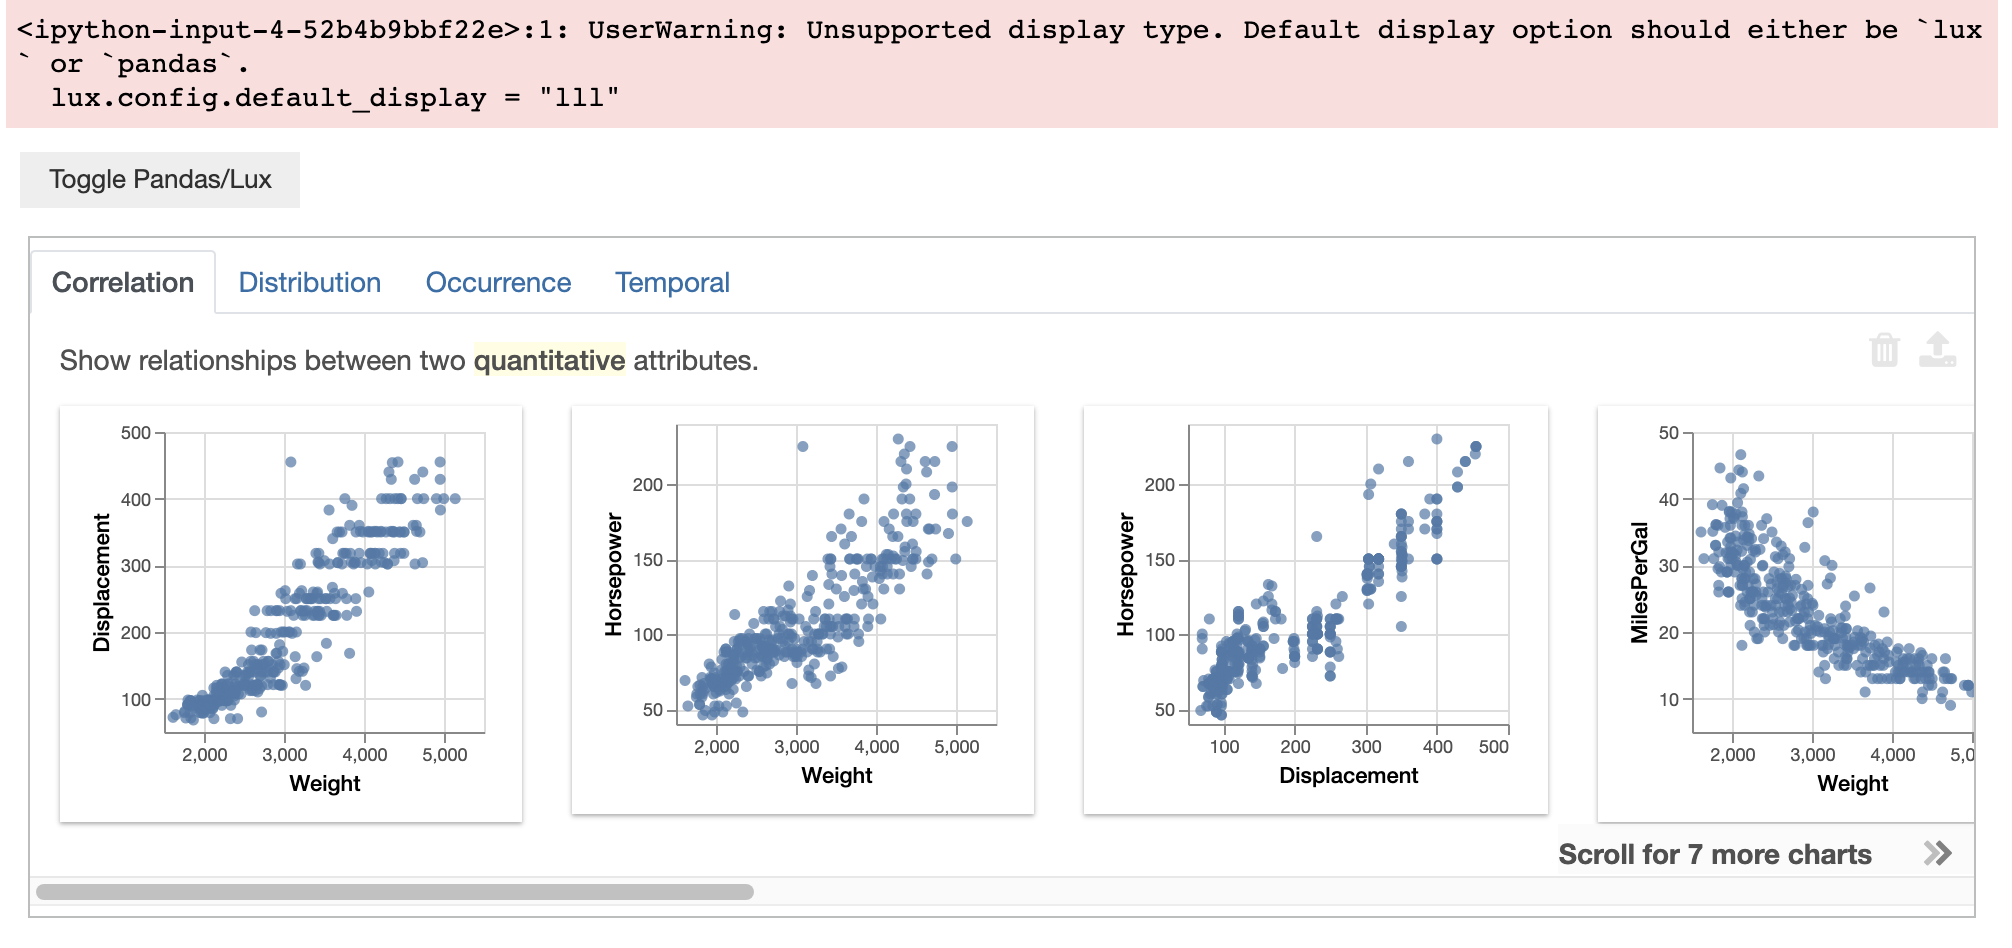
If you try to set the default_display to anything other than ‘lux’ or ‘pandas,’ a warning will be shown, and the display will default to the previous setting.
lux.config.default_display = "notpandas" # Throw an warning
df
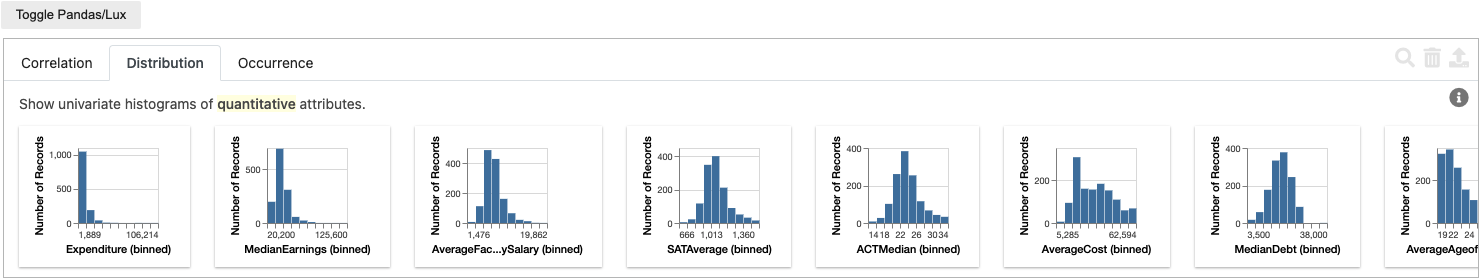
Change the plotting scale
We can adjust the sizes of charts displayed in the Lux widget based on a plotting_scale applied to all charts. The default plotting scale is set to 1, displayed as followed:
In the following block, we set the plotting_scale to 2. We see that the Lux widget displays charts two times larger than the default.
lux.config.plotting_scale = 2
df
When further operations are performed (e.g., specifying intent), the user-defined plotting scale continues to apply to both the current visualization and recommended charts. In addition to specifying plotting_scale as a positive float (i.e., >1.0, enlarging the charts), plotting_scale can also take in any positive float between [0,1] to shrink the size of the charts.
lux.config.plotting_scale = 0.5
df
The plotting_scale config takes in any positive float or integer and functions for both Altair and Matplotlib plotting backends.
Change plotting backend for rendering visualizations in Lux
We can set the plotting_backend config to change the plotting library used for rendering the visualizations in Lux.
This is often useful not just for stylizing plot aesthetics, but also to change the code generated when exporting a visualization.
For example, if you are more familiar with matplotlib , you may want to use a matplotlib plotting backend so that you can make use of the exported visualization code. In the following code, we set the plotting backend to ‘matplotlib’, and Lux will display the Matplotlib rendered charts.
lux.config.plotting_backend = "matplotlib"
df
We can set the vislib back to the default ‘vegalite,’ which uses Vega-Lite to render the displayed chart.
lux.config.plotting_backend = "vegalite"
df
Lux currently only support Vega-Lite and matplotlib, and we plan to add support for other plotting libraries in the future. If you try to set the plotting_backend to anything other than ‘matplotlib’ or ‘vegalite’, a warning will be shown, and the display will default to the previous setting.
lux.config.plotting_backend = "notvegalite" # Throw an warning
df
Change the sampling parameters
To speed up the visualization processing, by default, Lux performs random sampling on datasets with more than 10000 rows. For datasets over 30000 rows, Lux will randomly sample 30000 rows from the dataset.
If we want to change these parameters, we can set the sampling_start and sampling_cap via lux.config to change the default form of output. The sampling_start is by default set to 10000 and the sampling_cap is by default set to 30000. In the following block, we increase these sampling bounds.
lux.config.sampling_start = 20000
lux.config.sampling_cap = 40000
If we want Lux to use the full dataset in the visualization, we can also disable sampling altogether (but note that this may result in long processing times). Below is an example if disabling the sampling:
lux.config.sampling = False
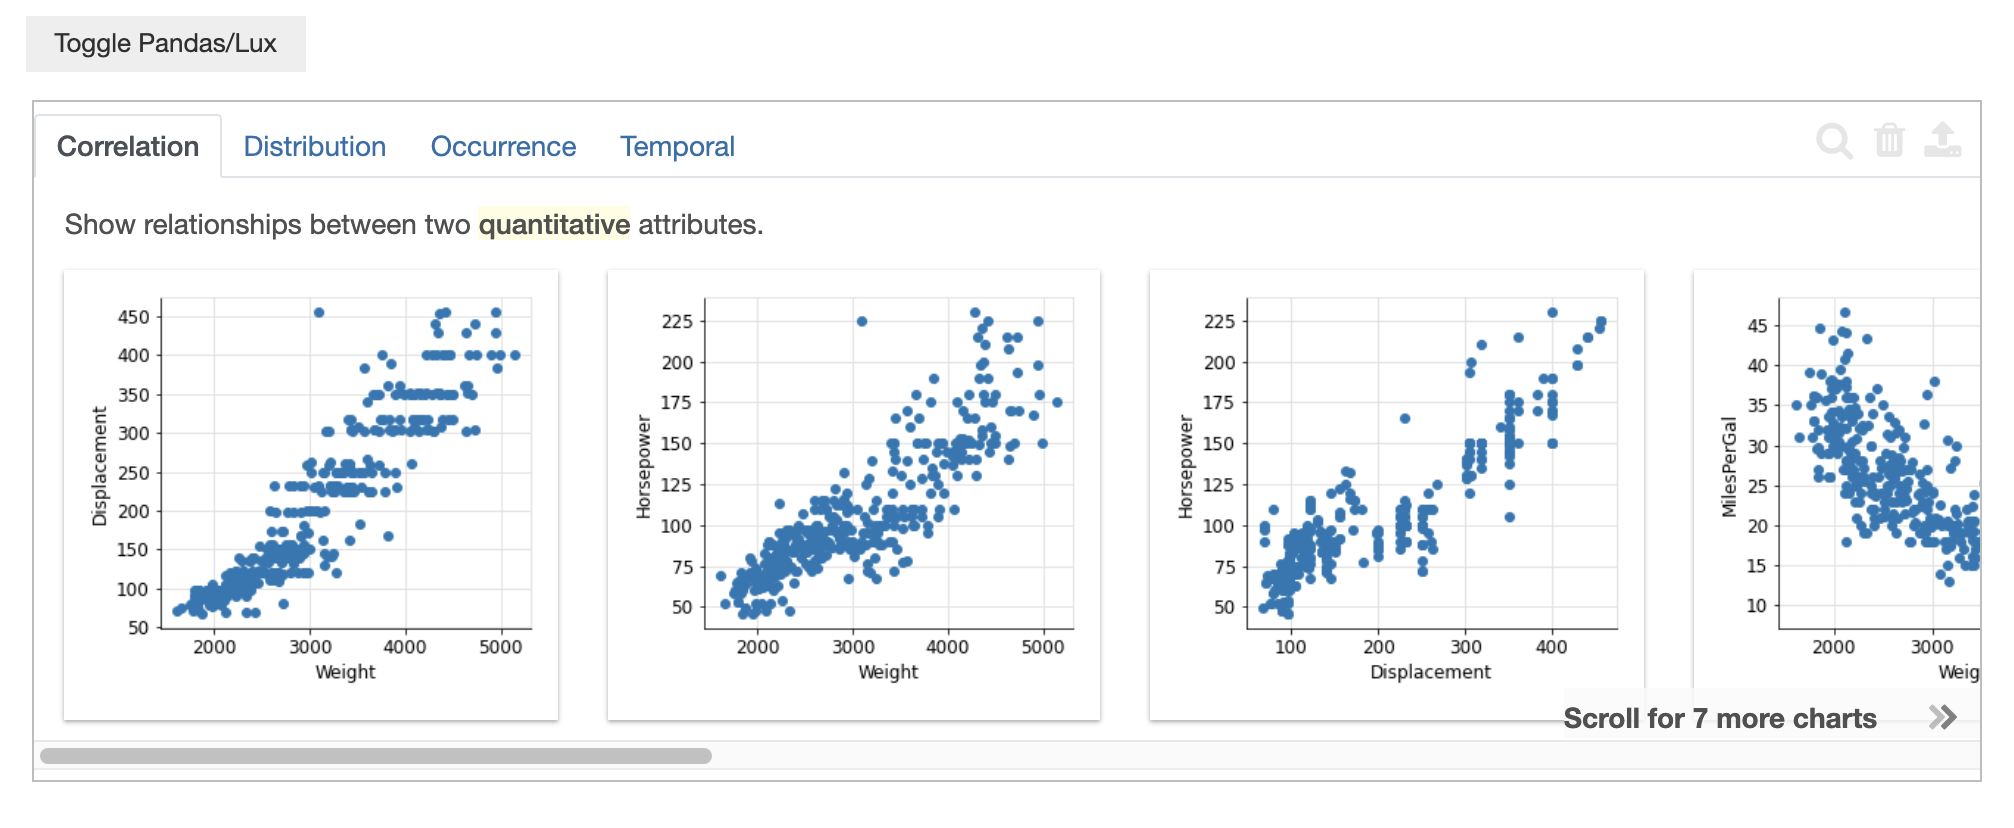
Disable the use of heatmaps for large datasets
In addition to sampling, Lux replaces scatter plots with heatmaps for datasets with over 5000 rows to speed up the visualization process.
We can disable this feature and revert back to using a scatter plot by running the following code block (but note that this may result in long processing times).
lux.config.heatmap = False
Changing the plotting style
In Lux, we can change the chart settings and aesthetics by inputting global custom plot settings the plotting_style.
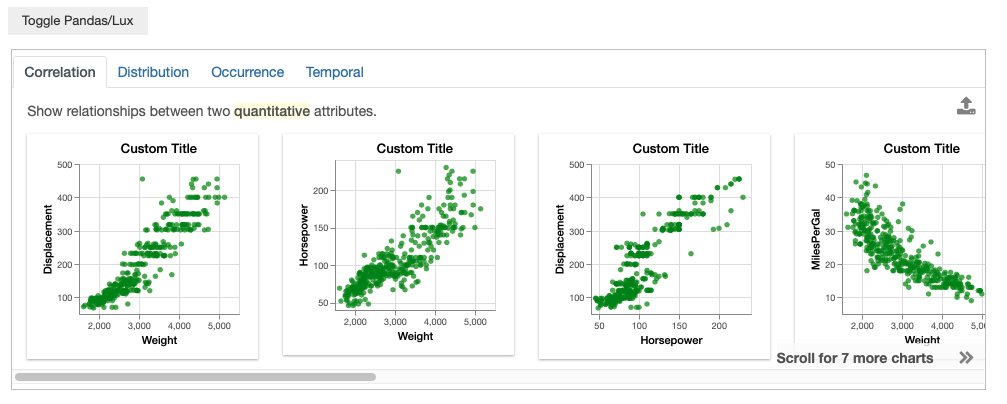
For charts rendered in Altair (default), we can change the plotting style by writing a function that takes a AltairChart object as input and output. For example:
def change_color_add_title(chart):
    chart = chart.configure_mark(color="green") # change mark color to green
    chart.title = "Custom Title" # add title to chart
    return chart
Then, set the plotting_style to this function so that this function is applied to every plot generated.
lux.config.plotting_style = change_color_add_title
The above results in the following changes:
Matplotlib also supports plot configurations to be applied on top of the generated graphs. To set a default plot configuration, first write a function that can take in a fig and ax and returns a fig and ax. fig handles figure width and other plot size attributes. ax supports changing the chart title and other plot labels and configurations. For example:
lux.config.plotting_backend = "matplotlib"

def change_width_add_title(fig, ax):
    fig.set_figwidth(7) # change figure width
    ax.set_title("Custom Title") # add title to chart
    return fig, ax

lux.config.plotting_style = change_width_add_title
See this page for more details.
Modify Sorting and Ranking in Recommendations
In Lux, we select a small subset of visualizations to display in each action tab to avoid displaying too many charts at once.
Certain recommendation categories ranks and selects the top K most interesting visualizations to display.
You can modify the sorting order and selection cutoff via lux.config.
By default, the recommendations are sorted in a "descending" order based on their interestingness score, you can reverse the ordering by setting the sort order as:
lux.config.sort = "ascending"
To turn off the sorting of visualizations based on its score completely and ensure that the visualizations show up in the same order across all dataframes, you can set the sorting as “none”:
lux.config.sort = "none"
For recommendation actions that generate a lot of visualizations, we select the cutoff criteria as the top 15 visualizations. If you would like to see only see the top 6 visualizations, you can set:
lux.config.topk = 6
If you would like to turn off the selection criteria completely and display everything, you can turn off the top K selection by:
lux.config.topk = False
Beware that this may generate large numbers of visualizations (e.g., for 10 quantitative variables, this will generate 45 scatterplots in the Correlation action!)
Changing heatmap bin resolution
In Lux, large scatterplots are displayed as heatmaps that are 40x40 by default. You can increase or decrease the heatmap resolution NxN by changing the bin size N:
lux.config.heatmap_bin_size = 100
This generates heatmap visualizations that are binned into a 100x100 grid.
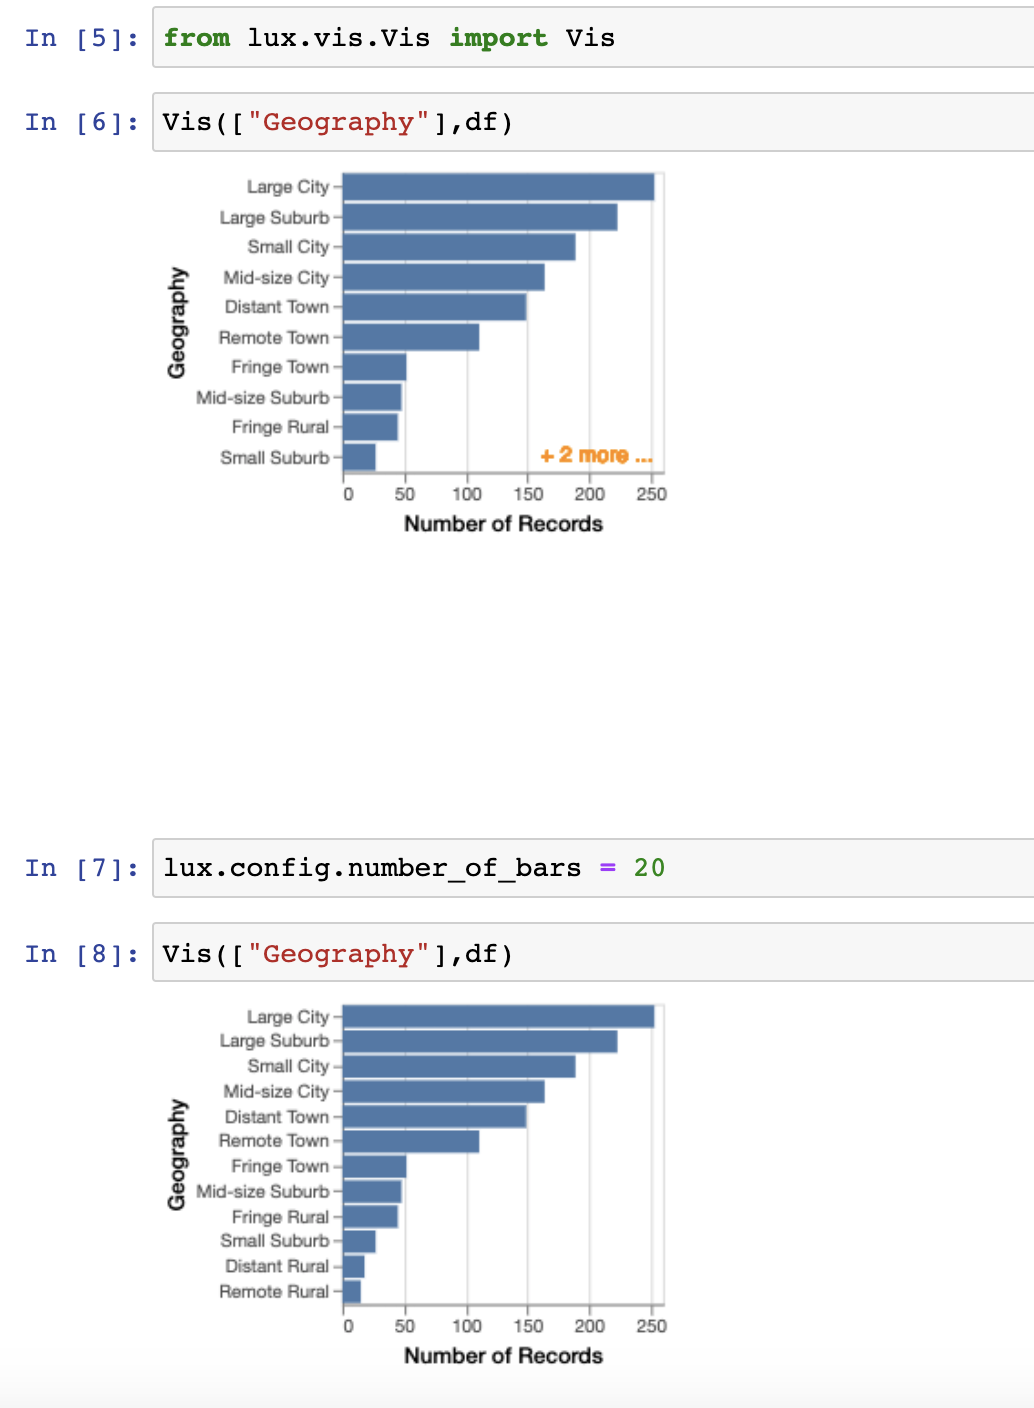
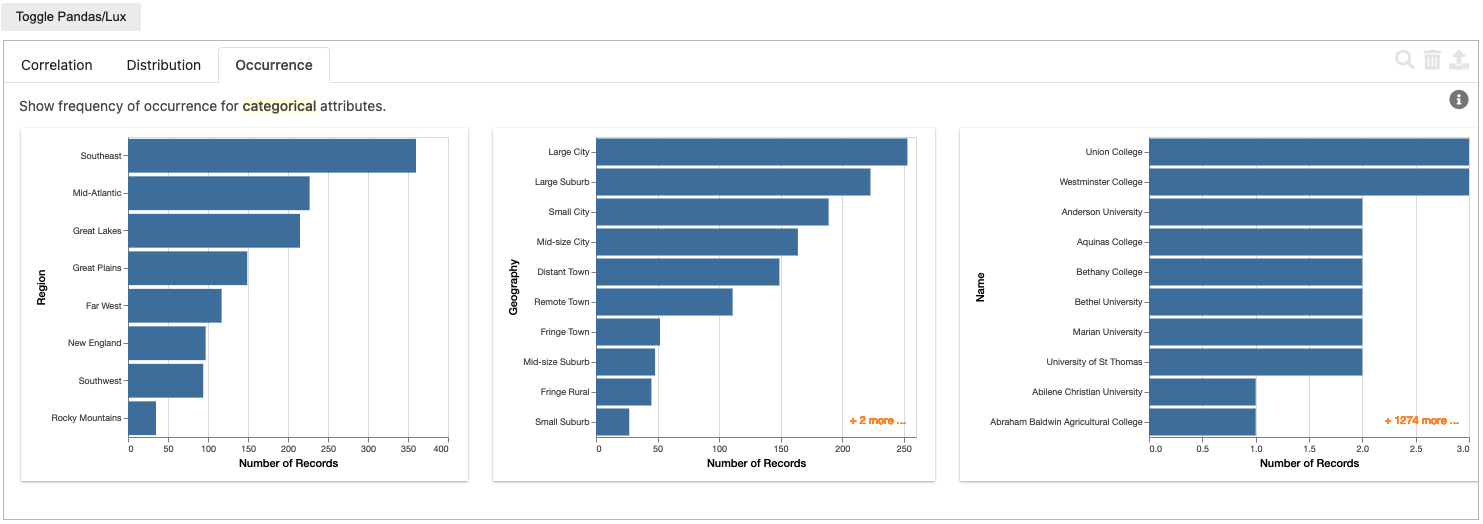
Change the maximum number of bars displayed
In Lux, we limit the maximum number of bars displayed in a bar chart to 10 bars to avoid cluttering.
If you want Lux to display more bars in each chart, we can set the number_of_bars to increase the maximum number of bars displayed.
lux.config.number_of_bars = 20